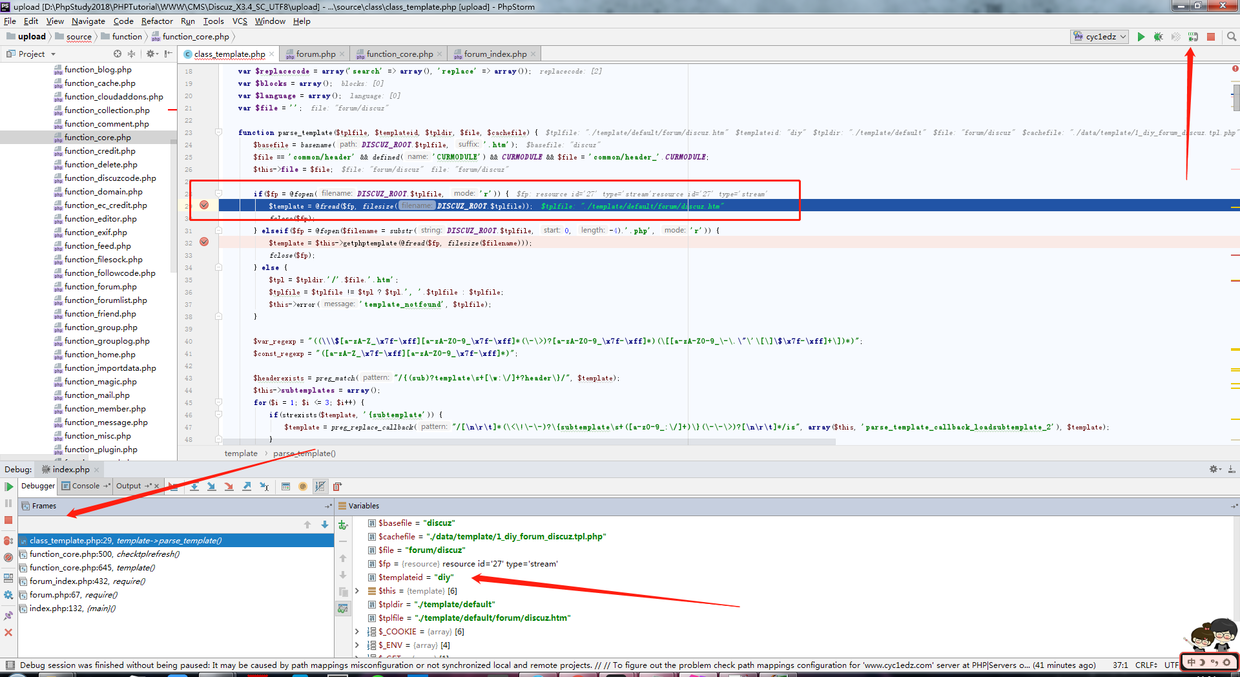
配置本地的phpstorm + Xdebug动态环境真的是一个糟心的事,之前一直出问题,现在重新配简单的记录下,本地的php环境是用phpstudy实现,各个版本都默认带有xdebug插件,php.ini中配置调用就好。
0x01 php.ini配置
1 | zend_extension="D:\PhpStudy2018\PHPTutorial\php\php-7.0.12-nts\ext\php_xdebug.dll" //xdebug.dll物理地址 |
0x02 PHPstorm配置
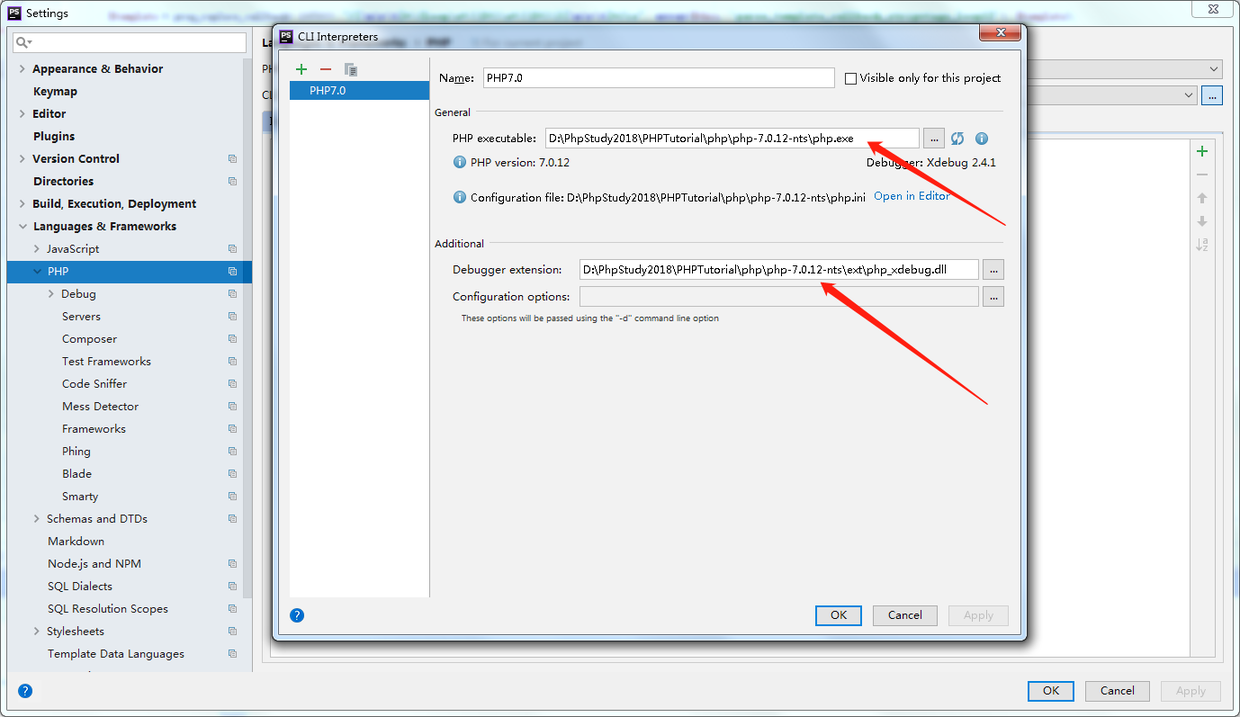
1)File | Settings | Languages & Frameworks | PHP
配置对应的php版本
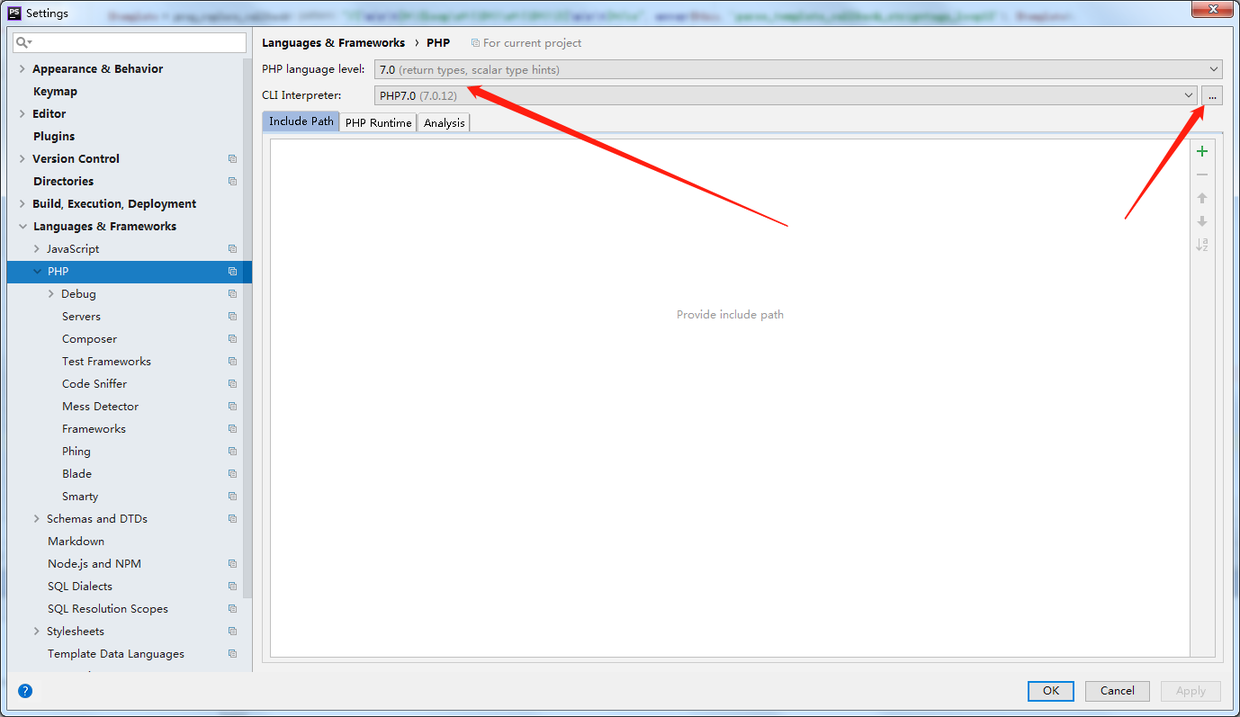
接着配置一下PHP.exe的路径和xdebug插件的路径
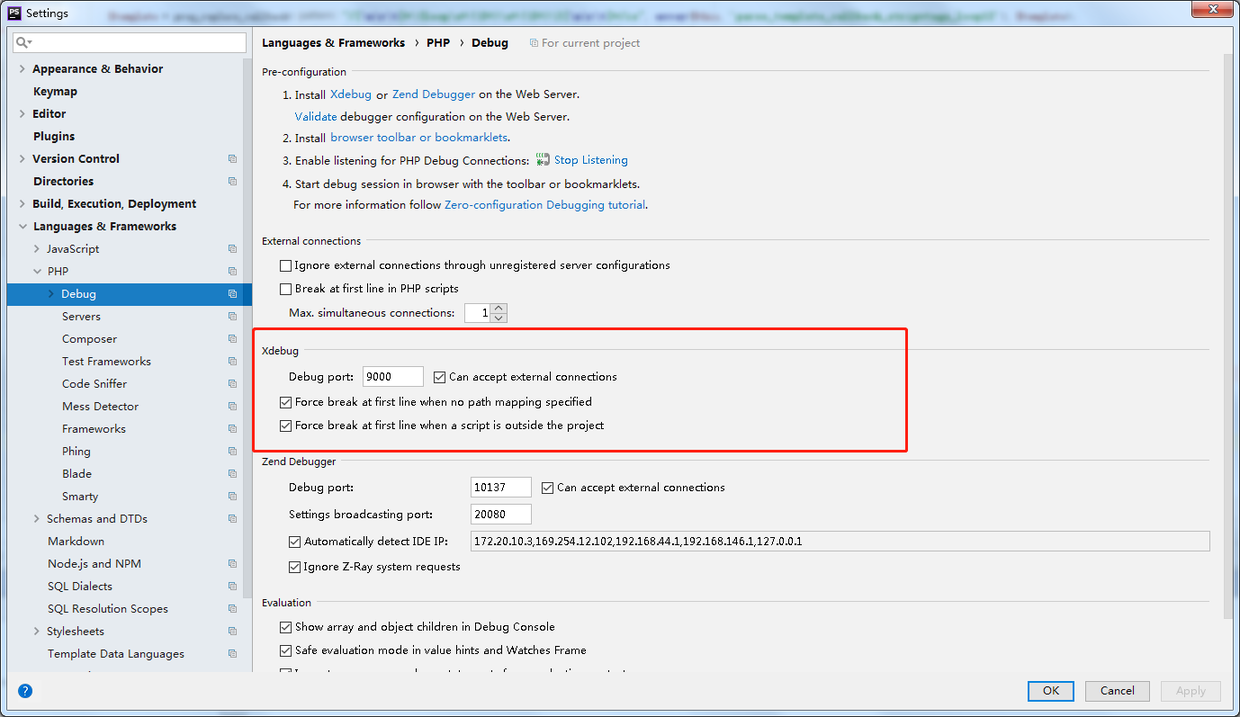
2)File | Settings | Languages & Frameworks | PHP | Debug
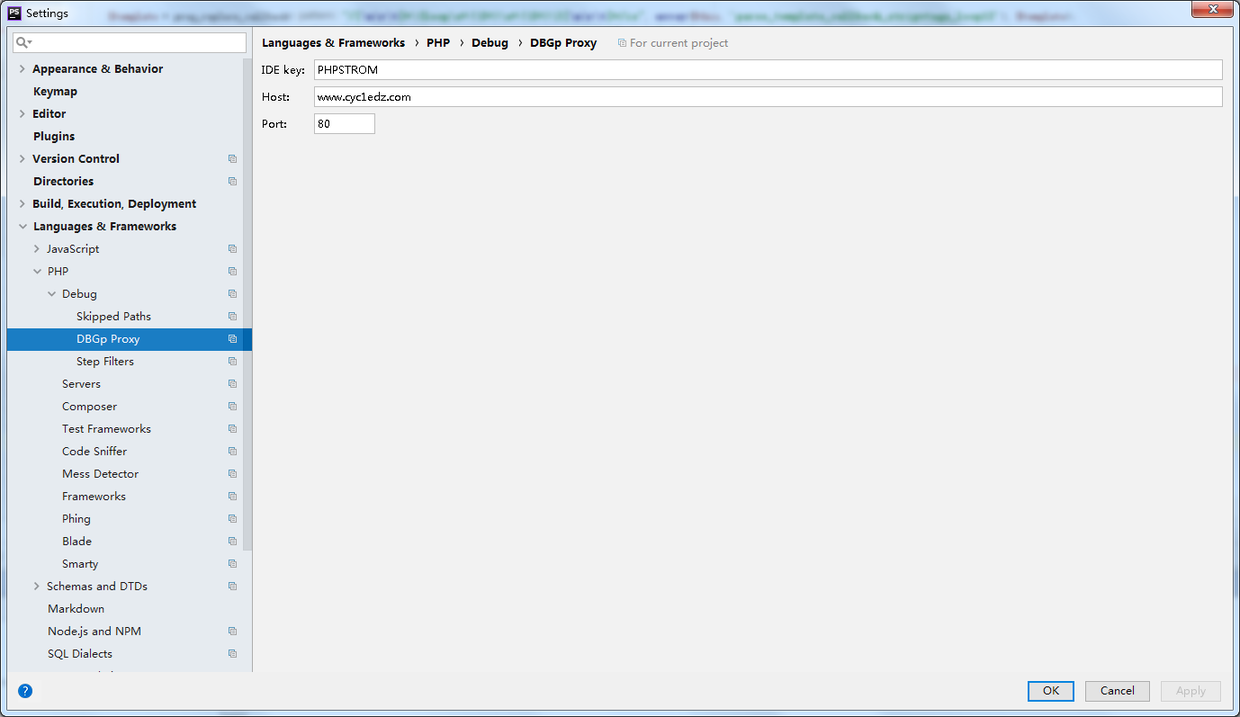
3)File | Settings | Languages & Frameworks | PHP | Debug | DBGp Proxy
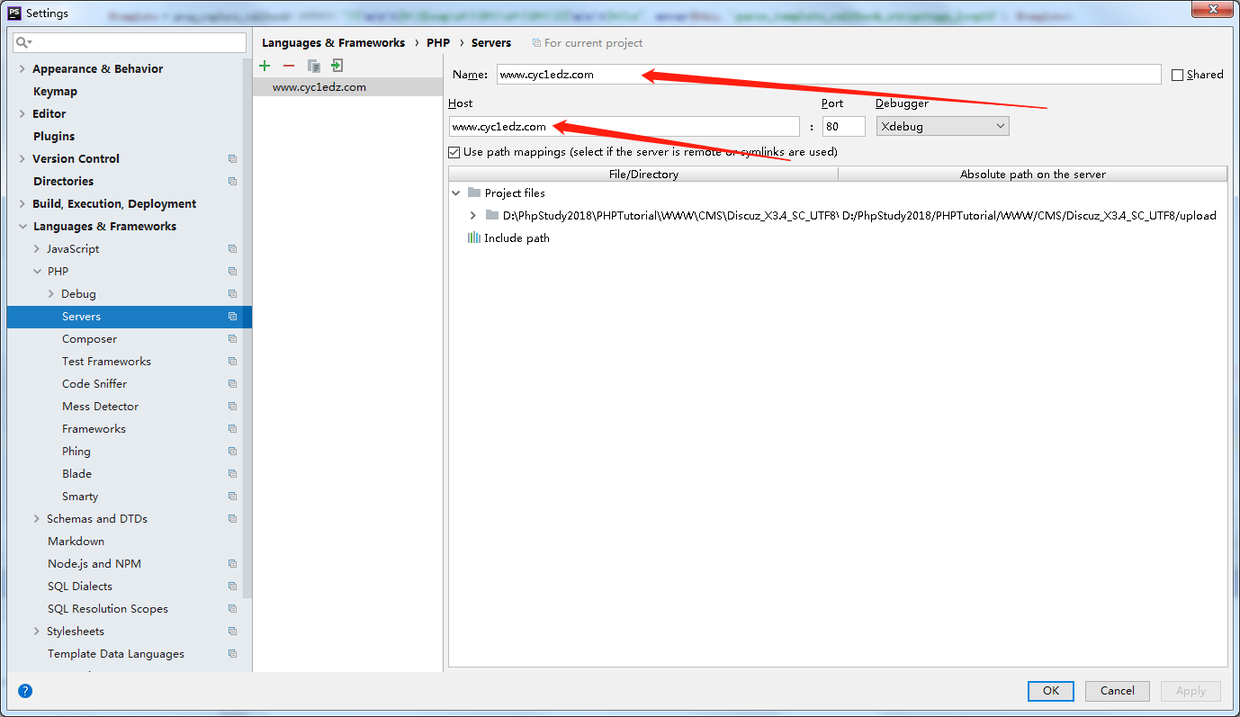
4)File | Settings | Languages & Frameworks | PHP | Servers
配置Host信息,也就是web服务信息(Use path mappings也可以点上,有些文件找不到路由关系)
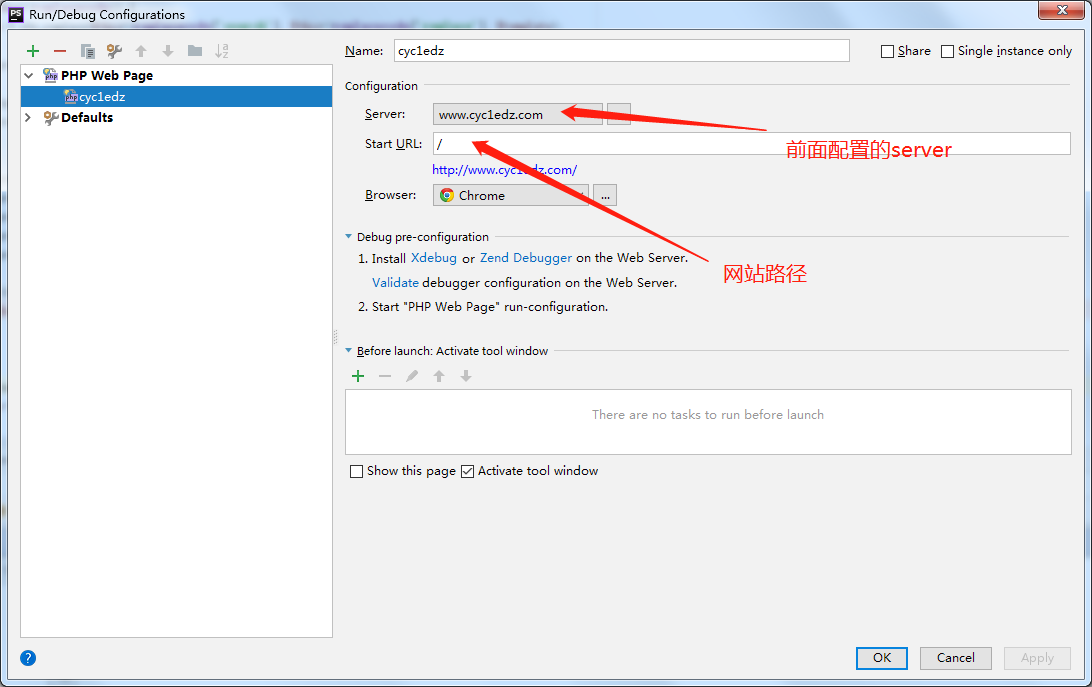
5)Run | Edit Configurations -> Add New Configurations
添加一个PHP Web Page页面,配置好相关的Configuration信息,个人习惯用Chrome
0x03 Chrome插件配置
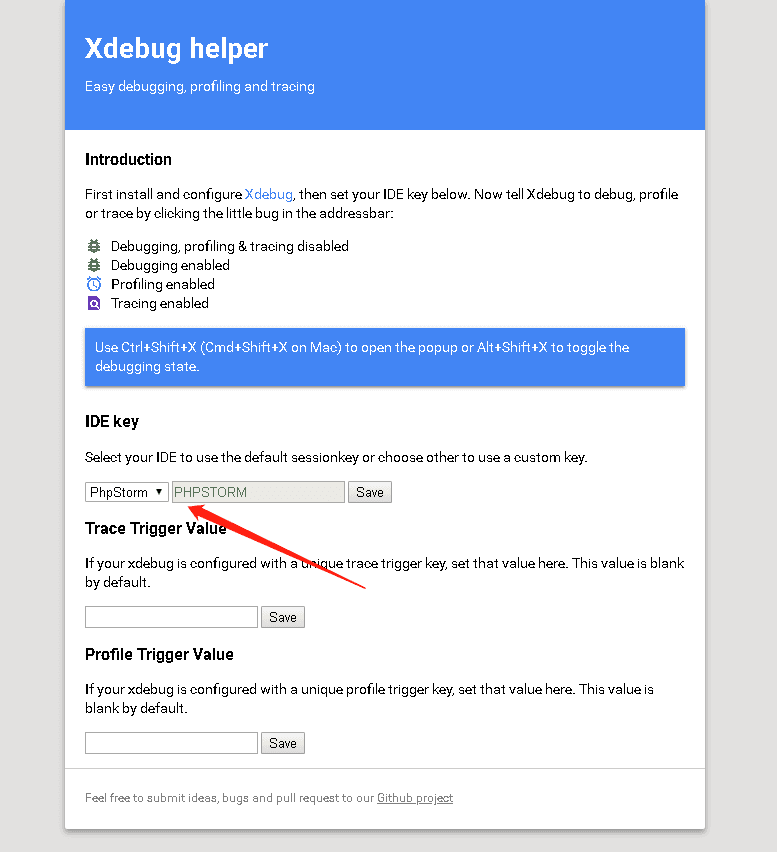
Chrome浏览器安装 Xdebug helper 插件,IDE key配置成PhpStorm就OK
到这里就都配置完毕了,动调的时候在相关页面下好断点,Chrome的 Xdebug helper 开启debug模式,phpstorm打开监听模式(右上角的小电话)